
WCP: How Government Statistics Define the Stories of the Working Class
Posted in News Working-Class Perspectives | Tagged Christopher R. Martin
One of my favorite media criticism works is British journalist and media professor Brian Winston’s “On Counting the Wrong Things.” He argues that the categories we use to count can themselves lead to misleading conclusions. Deciding to count the number of violent acts on television in the 1970s, for example, implied that any depictions of violence are bad. But it didn’t help us consider the meaning of violence, who commits it, and who its victims are.
Getting an accurate count is important, but deciding what to count in the first place may be even more important. This applies to our economic metrics. What we count defines the stories journalists tell, or don’t tell, about work and the working class.
In the U.S., the primary measurement of our economic health is the monthly “jobs report” issued by the U.S. Bureau of Labor Statistics. Our obsession with these metrics stretches back to the Great Depression, when unemployment rose to 24.9 percent in 1933, making the need for a better way to measure unemployment “especially acute.” The monthly unemployment survey was created in 1940. It became the responsibility of the U.S. Census Bureau in 1942. It has since evolved into the BLS’s Current Population Survey jobs report.
On the first Friday of each month, at 8:30 a.m. Eastern Time, the BLS releases its “Employment Situation Summary.” The report, informally called the “jobs report,” includes national labor force gains or losses from the previous month and the unemployment rate, each reported for various demographic characteristics. It also notes gains or losses in the labor force, hours worked, and earnings by industry.
It’s a lot of data, but the top story each month, reported breathlessly by the news media every Friday morning, focuses on employment numbers and unemployment rates (and does so despite longstanding concerns that the numbers grossly underestimate unemployment). Whoever writes press releases for the BLS seems to understand the appeal of that data to the news media and puts that information in the first line of the document. The press release from Oct. 8, 2021, began this way:
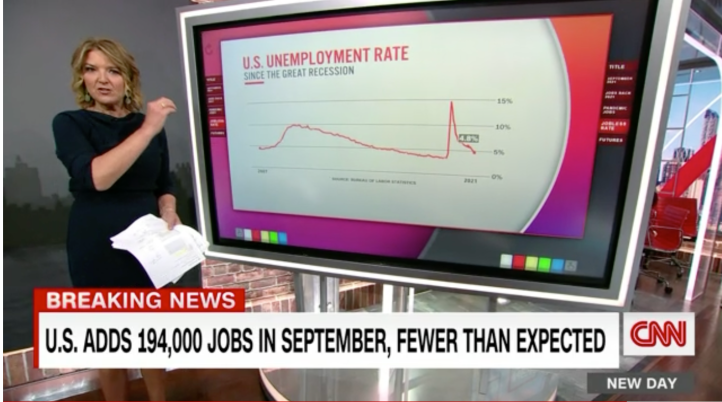
Total nonfarm payroll employment rose by 194,000 in September, and the unemployment rate fell by 0.4 percentage point to 4.8 percent, the U.S. Bureau of Labor Statistics reported today.
For the rest of the morning, the news media spun the interpretation, issuing the monthly verdict on the economy, often with little nuance:
CNN: Another disappointment: US economy adds only 194,000 jobs in September
New York Times: Jobs Report Offers Little Reassurance on U.S. Economy
NBC: What’s behind the lackluster September jobs report
Wall Street Journal: U.S. Job Growth Falls to Slowest Pace of Year
Headlines aren’t always so direct. The Associated Press and Washington Post offered more complex takes:
Associated Press: EXPLAINER: 5 key takeaways from the September jobs report
Washington Post: America’s unemployed are sending a message: They’ll go back to work when they feel safe – and well-compensated
As these headlines show, our national fixation on the unemployment rate crowds out attention to almost any other economic measure – including metrics that would tell us more about workers’ experiences. Consider the “quits rate.” As the BLS explains, “the quits rate is the number of quits during the entire month as a percent of total employment.” Because quitting is voluntary (unlike layoffs and firings), this figure can tell us something about workers’ level of dissatisfaction with their jobs, particularly within a certain industry.
Quits rates were in the news recently because the August 2021 quits rate of 2.9 percent was the highest since data were first collected in December 2000. Quits were especially high in the leisure and hospitality sector, at a rate of 6.4 percent. Trade, transportation, and utilities hit an all-time sector high quits rate in August, as well, at 3.7 percent.
The quits rate is released a week after the jobs report each month as part of the Job Openings and Labor Turnover Summary (JOLTS) report, but that report gets almost no attention. Although the quits rate is reportedly Secretary of the Treasure Janet Yellen’s favorite economic indicator, it is rarely used to tell stories about American workers. In fact, a search of the Nexis news database (eliminating any stories about cigarette smoking) finds that in more than 20 years, only 20 New York Times stories used the term. During the same two-decade period, the Times published 3,971 articles on “job report” or “jobs report.”
One major economic metric is not enough. As the quits, protests, strikes, and walkouts over the past few years have illustrated, there is much more to know about our economy than the unemployment rate. A person can have normal temperature but have many other signs of illness. We need better ways to diagnosis our economy, too – especially data that would reveal the fuller experience of working-class people. The BLS could promote other data with the same gusto as the jobs report, and journalists could dig deeper than the easiest economic story of the month.
For example, every month the BLS provides data on average hourly earnings and productivity rates. Why not analyze the two together each month, to track the relationship between earnings and productivity? Why not bring more attention to the monthly rate of women’s earnings as a percentage of men’s? Or the rate of earnings for Black and Hispanic Americans compared with white workers’ wages? What about the rate of workplace injuries and fatalities, or the rate of compensation meeting or exceeding cost-of-living expenses in each region? What about monthly rate of health care coverage and the cost of health care to workers?
I know what some statisticians and journalists might be thinking: This could be boring – the same story every month. Yet, these measures could highlight the many things the working class lacks – opportunity, mobility, fairness, compensation keeping pace with productivity, jobs with living wages. We need to hear the truths of those stories every month. The lack of progress is itself a story. These are some of the things we need to count, to make workers’ experiences visible and keep the powerful accountable.
Christopher R. Martin is a professor of digital journalism at the University of Northern Iowa and the author of No Longer Newsworthy: How the Mainstream Media Abandoned the Working Class (ILR/Cornell University Press).